Fleet Management Dashboard: 12 KPIs to Track and How to Build One
Advertisement
What Is a Fleet Management Dashboard?
A fleet management dashboard is a single screen that shows, at a glance, whether a fleet of vehicles is available, safe, on budget and compliant. It pulls data from telematics devices, fuel cards, maintenance records and dispatch or delivery systems, turns it into a small set of key performance indicators, and flags the exceptions that need action today: a van overdue for service, a driver with three harsh-braking events this week, a route running 40 percent over its fuel budget.
The reason it matters is cost concentration. The American Transportation Research Institute's operational costs of trucking research put the average cost of running a heavy truck at a record $2.34 per mile in 2025, with driver wages and benefits, fuel, and truck and trailer payments making up the bulk of it. Light commercial fleets run lower per mile (the IRS business standard mileage rate, based on the fixed and variable costs of running a car, is 76 cents a mile for the second half of 2026), but the same cost lines dominate, and a dashboard that moves any of them by five percent can pay for itself many times over.
This guide covers who the dashboard is for, the twelve KPIs that matter, realistic target ranges, the data sources behind each number, a layout that people actually use, and three ways to build one, from a spreadsheet to a custom app.
Who Uses a Fleet Management Dashboard
Three people look at a fleet dashboard, and they need different views of the same data. Build for all three or the dashboard will please none of them.
| Role | Looks at it | Needs to see | Typical action |
|---|---|---|---|
| Fleet manager | Daily | Utilization, availability, downtime, maintenance due, cost trend | Reassign vehicles, schedule service, chase repairs |
| Dispatcher or operations lead | Hourly | Vehicle status, driver assignments, on-time performance, live locations | Re-route, swap drivers, call customers |
| Owner or finance | Weekly or monthly | Cost per mile, fuel spend, total cost of ownership, accident rate | Approve replacements, renegotiate fuel, adjust pricing |
Advertisement
The 12 Fleet Management KPIs to Track
These twelve cover almost every fleet from ten vans to a thousand trucks. Each is defined by a formula so two people looking at the same tile get the same number.
Availability and Utilization
These three tell you whether the fleet is the right size and how much of it is ready to work.
Vehicle utilization rate = hours (or days) in use divided by hours available. The single most important number for right-sizing the fleet.
Vehicle availability = vehicles ready for service divided by total vehicles. Anything in the shop, awaiting parts or without a driver counts against it.
Unplanned downtime = hours out of service for unscheduled repairs per vehicle per month. Planned service is expected; unplanned is the number to drive down.
Cost
Cost KPIs show where the money goes, per mile and per vehicle.
Cost per mile = all operating costs divided by miles driven. Fuel, maintenance, tires, insurance, driver wages and depreciation, per vehicle and per class.
Fuel cost per mile = fuel spend divided by miles. Track it separately because it moves fastest and is the easiest to influence through routing and idling.
Idle time = engine-on, stationary minutes as a percentage of engine-on time. Every hour of idling burns roughly 0.2 to 0.5 gallons in a car or light van and about 1 gallon in a heavy diesel truck, according to Argonne National Laboratory research, and delivers nothing.
Total cost of ownership per vehicle = purchase price plus all operating costs minus resale value, over its life. The number behind every replace-or-keep decision.
Safety and Compliance
These three predict accidents, insurance premiums and breakdowns before they show up in the cost line.
Driver safety score = a weighted count of harsh braking, harsh acceleration, speeding and cornering events per 100 miles, from telematics.
Accident rate = preventable accidents per million miles. Small fleets track raw counts and trend.
Maintenance compliance = scheduled services completed on time divided by services due. Below 90 percent, unplanned downtime tends to rise within a quarter.
Service and Asset
The last two link the fleet to its customers and to the replace-or-keep decision.
On-time delivery or arrival rate = jobs completed within the promised window divided by total jobs.
Average vehicle age and mileage = the fleet's position on the replacement curve. Repair cost per mile rises sharply after a threshold that differs by vehicle class.
Fleet KPI Targets and Benchmarks
Targets vary by industry, vehicle class and region, so treat these as starting points and replace them with your own trailing-twelve-month figures after the first quarter.
| KPI | Typical starting target | Warning threshold |
|---|---|---|
| Vehicle utilization | 70 to 85 percent of available hours | Below 60 percent (fleet too large) or above 90 percent (no slack for downtime) |
| Vehicle availability | 95 percent or higher | Below 90 percent |
| Unplanned downtime | Under 8 hours per vehicle per month | Over 16 hours |
| Idle time | Under 10 percent of engine-on time (delivery); under 20 percent (service with power take-off) | Over 25 percent |
| Maintenance compliance | 95 percent on time | Below 90 percent |
| Driver safety events | Below your fleet's own 90-day baseline, trending down | Any driver more than twice the fleet average |
| On-time delivery | 95 percent within window | Below 90 percent |
| Fuel cost per mile | Set from your own trailing 12 months | More than 10 percent above the 90-day average |
Advertisement
Where Fleet Dashboard Data Comes From
Every KPI above comes from one of five sources. Knowing which is which tells you what to connect first and where the numbers will disagree.
| Source | Feeds | How the data arrives |
|---|---|---|
| Telematics and ELD (Samsara, Geotab, Motive, Verizon Connect and others) | Location, engine hours, idle time, mileage, harsh events, fault codes | Vendor API or scheduled CSV export; near real time |
| Fuel cards (WEX, Corpay brands such as Fuelman, Shell and others) | Fuel volume, cost, location and time per transaction | Daily transaction file or API |
| Maintenance system or workshop records | Services due and completed, repair costs, downtime hours | Fleet maintenance software API or a spreadsheet |
| Dispatch, TMS or delivery platform | Jobs, time windows, on-time performance, miles per job | API or export |
| Finance system | Insurance, depreciation, lease payments, wages | Monthly export |
Mileage is the number most likely to disagree between sources: the odometer from telematics, the mileage entered at the pump and the miles in the dispatch system rarely match. Pick telematics as the source of truth for miles, and reconcile the others against it monthly.
A Fleet Management Dashboard Layout That Works
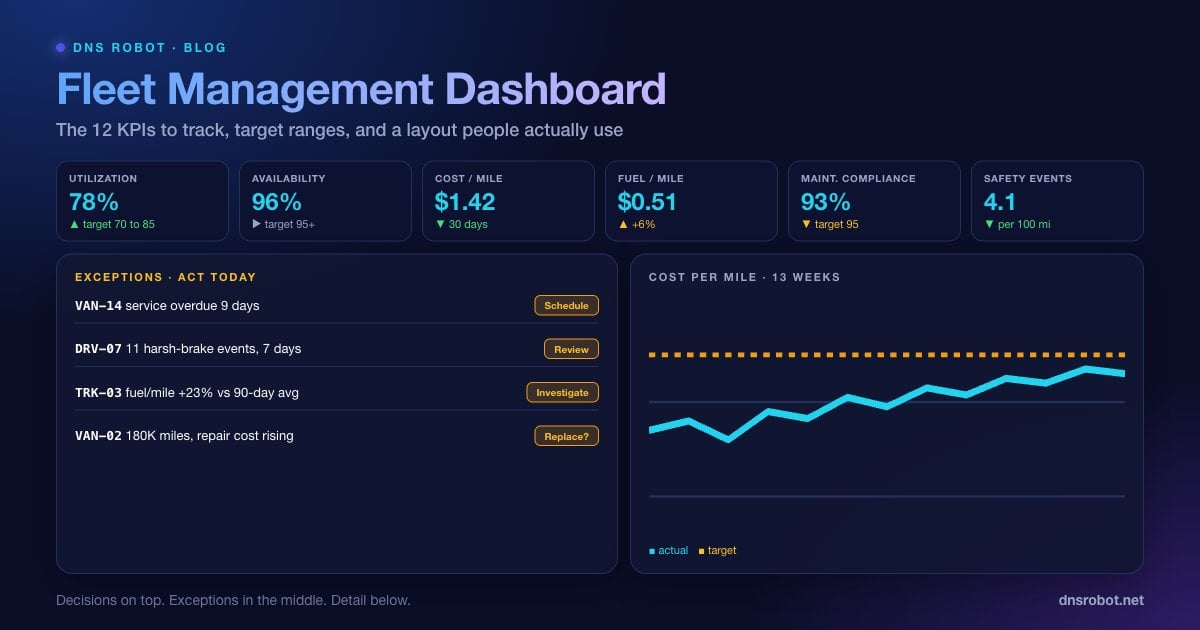
The layouts that survive contact with a busy fleet office share one structure: decisions at the top, exceptions in the middle, detail at the bottom. Nobody scrolls to find the number that matters.
+---------------------------------------------------------------+
| ROW 1  Six KPI tiles: value, target, 30-day trend arrow        |
|  Utilization | Availability | Cost/mile | Fuel/mile |          |
|  Maintenance compliance | Safety events per 100 mi            |
+---------------------------------------------------------------+
| ROW 2  Exceptions (sorted by urgency, each row is an action)    |
|  ! VAN-14  service overdue 9 days        [Schedule]            |
|  ! DRV-07  11 harsh-brake events, 7 days  [Review]             |
|  ! TRK-03  fuel/mile +23% vs 90-day avg   [Investigate]        |
+---------------------------------------------------------------+
| ROW 3  Live map (optional) | Vehicle status table              |
|  Vehicle | Status | Driver | Next service | Miles | Cost/mile  |
+---------------------------------------------------------------+
| ROW 4  Trends: cost per mile, idle %, downtime (13 weeks)       |
+---------------------------------------------------------------+Row 2 is what makes it a dashboard rather than a report. Every exception has a threshold, a reason and a button or link to the action. If the fleet manager can clear the list by the end of the day, the dashboard has done its job.
Advertisement
How to Build a Fleet Management Dashboard: Three Ways
The right build depends on how many data sources you have and whether people need to act inside the dashboard or just read it.
Option 1: Spreadsheet (Up to About 30 Vehicles)
Google Sheets or Excel with one tab per data source (telematics export, fuel transactions, maintenance log, jobs) and a dashboard tab of formulas and charts on top. It takes a day to set up and an hour a week to refresh with exports. It stops working when the exports outgrow copy-paste or when more than two people need it at once.
Option 2: BI Tool (30 to Several Hundred Vehicles)
Looker Studio, Power BI or Metabase connected to a small database that scheduled jobs fill from the telematics and fuel card APIs. Live data, shared access, and drill-down from a tile to a vehicle. This is where most mid-sized fleets should be, and the vendor telematics dashboards are often enough on their own if the fleet has one telematics provider and no fuel card data to merge.
Option 3: Custom App (When Users Need to Act Inside It)
When the dispatcher needs to schedule the service from the exception row, message the driver, or update a job status without leaving the screen, the dashboard becomes an application. In 2026 a first version is a realistic build of a few days with an AI app builder on top of a Supabase database: the builder handles logins, the tables, the charts and the hosting, and you connect the telematics API with a scheduled function. The best vibe coding tools guide compares the builders and the vibe coding apps guide walks through the workflow.
Build a fleet management dashboard. Tables: vehicles (id, plate, class, odometer, next_service_miles, status), drivers (id, name, safety_score), fuel_transactions (vehicle_id, date, gallons, cost, odometer), maintenance (vehicle_id, type, due_date, completed_date, cost, downtime_hours), jobs (vehicle_id, driver_id, date, on_time boolean, miles). Home page: six KPI tiles with value, target and 30-day trend for utilization, availability, cost per mile, fuel cost per mile, maintenance compliance and average safety score; an exceptions list of vehicles overdue for service, drivers with safety score below 70, and vehicles whose fuel cost per mile is 10% above their 90-day average, each with an action button; a vehicle status table with filters. Users log in; managers can edit, dispatchers can update job status only. Import CSVs for fuel and telematics.Connecting Telematics and Fuel Card Data
The major telematics providers expose APIs for vehicles, trips, fault codes and driver events, and most fuel card providers offer a daily transaction feed. The dashboard's scheduled job calls each API, writes the rows into the database, and recalculates the KPIs. A typical telematics call looks like this, and the response is a JSON list you can load straight into the vehicles table.
# Example: pull vehicle stats from a telematics API (shape varies by vendor)
curl -s "https://api.example-telematics.com/fleet/vehicles/stats?types=obdOdometerMeters,engineStates&time=$(date -u +%Y-%m-%dT%H:%M:%SZ)" \
  -H "Authorization: Bearer $TELEMATICS_API_TOKEN" | jq '.data[] | {id, name, odometer: .obdOdometerMeters.value, engine: .engineStates.value}'

# Before wiring it into a scheduled job, confirm the endpoint, latency and status code
curl -s -o /dev/null -w "%{http_code} %{time_total}s\n" "https://api.example-telematics.com/fleet/vehicles" -H "Authorization: Bearer $TELEMATICS_API_TOKEN"
Test each API from the command line before you build the integration, so you know the response shape, the rate limits and how the vendor signals errors. The test a public API endpoint guide covers the checks. Keep the API tokens in the app's environment variables, never in the dashboard code, and rotate them when a person with access leaves.
Advertisement
Securing a Dashboard That Shows Live Vehicle Locations
A fleet dashboard is a map of where every vehicle, and every driver, is right now. That makes it more sensitive than most internal tools, and the security basics are not optional. Serve it only over HTTPS with a valid certificate, confirmed with the SSL Checker. Send strict security headers, especially frame protection so the map cannot be embedded on another site; the HTTP Headers Checker grades them in seconds. Put the dashboard on its own subdomain such as fleet.yourcompany.com, require login for every page, and give dispatchers, managers and finance different roles.
If the dashboard runs on a server you control, close every port except 443 and check from the outside with the Port Checker; a database port open to the internet on a server holding vehicle locations is a breach waiting to happen. The web security best practices guide covers the full checklist, including password hashing and rate limiting on the login page.
Fleet Dashboard Mistakes to Avoid
Most fleet dashboards that get abandoned fail for one of these six reasons, and each has a simple fix.
Thirty KPIs on one screen. Six tiles at the top. Everything else is a drill-down.
Numbers without targets or trends. A value alone does not tell anyone what to do.
No exceptions list. If the dashboard does not tell the manager what to fix today, they stop opening it.
Three definitions of a mile. Choose telematics as the source of truth and reconcile the rest.
Building the app before the spreadsheet. The spreadsheet is where the formulas get argued over and fixed.
Treating vendor dashboards as the answer. They show their own data well and nothing else; the value is in merging telematics with fuel, maintenance and jobs.
Check the ports and certificate on your fleet dashboard server
DNS Robot's free Port Checker tests whether any port on your dashboard server is reachable from the internet, so you can confirm that only HTTPS is open and the database is not exposed. Pair it with the SSL Checker to verify the certificate before you share the dashboard with the team.
사용해보기 Port CheckerAdvertisement
Fleet Management Dashboard FAQ
Six headline KPIs with targets and trends (utilization, availability, cost per mile, fuel cost per mile, maintenance compliance, driver safety), an exceptions list of vehicles and drivers that need action today, a vehicle status table, and 13-week trend charts for cost, idle time and downtime.